Machine learning operations (MLOps) is currently one of the hottest areas for startup investment, because while best practices for building machine learning models are relatively well understood, a great deal of innovation is being poured into devising ways to best operationalize them for production. Chief among the MLOps categories is ML monitoring. Making sense of the landscape of ML monitoring tools can be frustrating, time consuming, and just plain confusing. Our goal with this article is to chart its cartography and, in doing so, hopefully illuminate some of the common pitfalls around choosing an appropriate monitoring solution, thereby bringing order to the chaos.
What is machine learning model monitoring?
In order to select an appropriate solution, it’s first necessary to agree on a definition of the problem. The overarching goal of machine learning model monitoring is to provide solutions which detect flaws in ML applications, prior to their negatively affecting downstream business KPIs. Because it is usually difficult to detect model issues prior to a KPI being impacted, specialized monitoring tools are needed. In that spirit, the following are fundamental requirements for ML monitoring tools.
First, ML monitoring is different and often more complex than monitoring for traditional software products. In the ML context, understanding whether systems are up or down is not enough. Instead, it’s necessary to ensure that systems are serving their intended function. Is the algorithm predicting what it’s supposed to? Is the customer data being reliably and periodically acquired and used to retrain the model? Can the business and its customers trust the model’s outcomes? These are all important questions to ask when monitoring machine learning models in production.
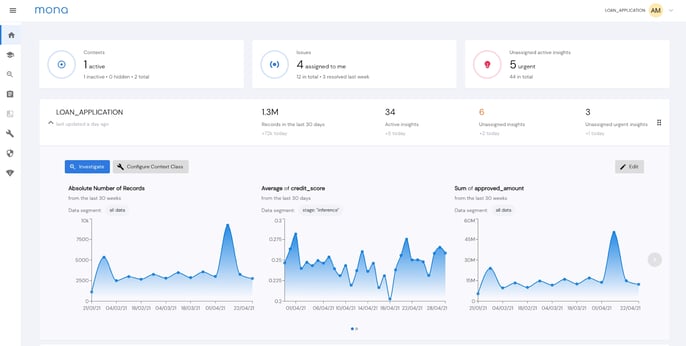
Mona’s “status check” dashboard- Provides you with a full picture of the health of your AI-based processes, not just your models
Second, ML models need to be monitored and understood in the context of their business function. Much of what this boils down to is devising and measuring the correct metrics, those which measure business process performance, not just model behavior. A more nuanced understanding is required than what model telemetry provides.
Third, proper monitoring tools need to monitor at very granular levels but do so intelligently, without creating so many alerts that it becomes noisy and distracting. Namely, changes in model behavior need to be detected before they propagate into more dramatic impacts on business KPIs that harm your business and lose you customers. Therefore, the best monitoring tools perform a very delicate balancing act that provides rich, granular data without alerting so frequently that it becomes overwhelming.
What isn't machine learning model monitoring?
Given the hype and level of investment in the MLOps space, many players have sprung up claiming to have created the next, best monitoring tool. However, many of these claimants for AI monitoring don’t perform as advertised. They can usually be binned into distinct subcategories, and the majority of available tools will cover just a single one of these feature sets.
Tools that provide infrastructure and application performance monitoring (APM)
Tools that fall into this bucket are often leftovers from the approach to traditional software monitoring and have merely been loosely adjusted to address the ML context. They often provide a good snapshot of the surface-level machinery of a system by tracking metrics such as latencies, error rates, and downtimes, but they usually fail entirely to address the algorithmic and data aspects of the ML pipeline. In other words, they are focused solely on the health of the infrastructure stack, yet are sometimes passed off as “ML monitoring” tools when the infrastructure is used to serve ML models. While this type of monitoring is important, it is a problem with many existing solutions and it’s just not “ML Monitoring”. APM tools are commonly part of cloud service offerings as they fall squarely within the cloud infra stack.
Anomaly Detection Tools
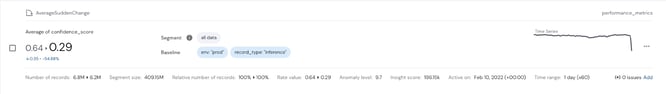
While being able to detect anomalies is a crucial part of monitoring, it is only one small part of what’s required for an end-to-end solution. Mona detects such anomalies, provides a full dashboard and an alerting system, and much more
As their name suggests, anomaly detection tools are designed to root out anomalies found in datasets. They can identify phenomena such as outliers, time series based anomalies, and distribution divergence. There’s no denying that these are important capabilities when building a monitoring solution. However, a full-fledged monitoring solution will include many additional components. A big data layer is essential for collecting relevant information about model inputs and outputs, business and technical metadata, and business feedback information from all relevant environments (dev / prod, train / inference, and ground truth labels). An interactive visualization layer allows for dashboarding, troubleshooting, report creation and data exploration and allows non-technical users to gain a glimpse into the system. Furthermore, an ML monitoring tool should be intelligent and able to detect anomalies automatically, in a configurable fashion, and to provide insightful context about anomalies it finds. Finally, there needs to be an operational layer to connect to your workflows, alert the right people at the right time, and track issues over time.
Experiment Tracking Tools
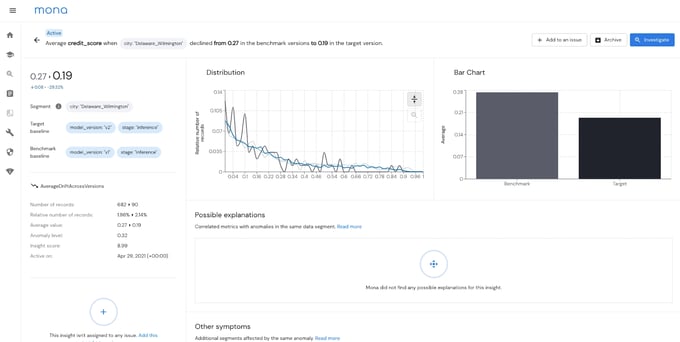
Mona detects drift in performance in specific segments, when measured across model versions in production
Experiment tracking tools are great in a research setting. They allow you to track your experiments from end-to-end and compare how models perform on siloed datasets and often provide features such as metric logging and tracking, automatic plot generation, data versioning, and the like. However, their limitations begin to show when you attempt to move your models to production. While they may be able to continue to monitor your model’s performance in a limited sense, they are not built to understand how an entire business process is affected by an interlocking system of software and ML components. Although they may provide rudimentary infra monitoring capabilities, they should not be confused for a full-fledged monitoring solution that can pinpoint how your business KPIs are being influenced by the interaction of chained models and data.
Explainability Tools
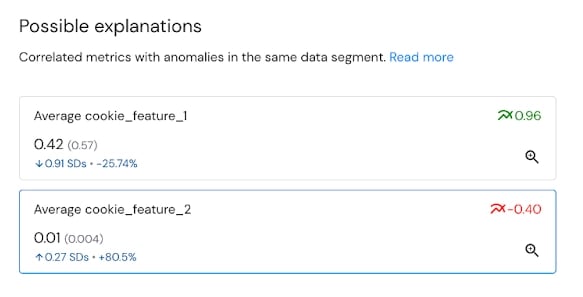
Mona automatically finds possible explanations for underperformance via correlated metrics and features
Explainability tools have been developed in response to the widespread use of neural networks and similarly opaque deep learning models, although most can be used with any model type. They focus on delivering understanding into how a model operates, usually by elucidating feature importance using metrics such as SHAP. Explainability is often conflated with monitoring as both types of tools work to deliver trust from a machine learning system. While this is important, explainability tools should be used in conjunction with monitoring solutions, not in place of them. Fundamentally, explainability products are restricted to understanding the features of a single model and do not deliver the holistic viewpoint into data, models, infrastructure, and business processes that true monitoring solutions do.
Troubleshooting Tools
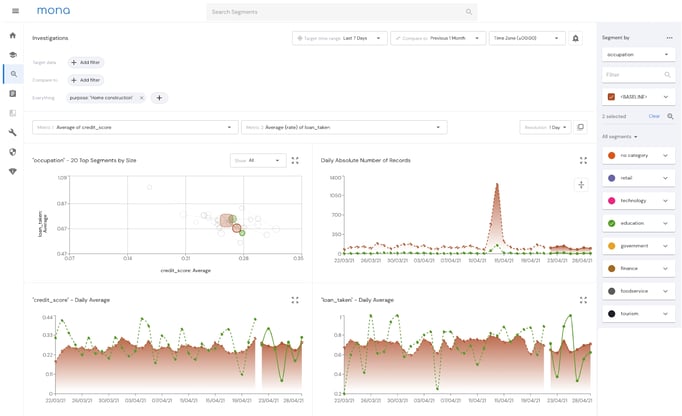
Mona’s “Investigations” Page - While the ability to troubleshoot issues as they arise is important, it’s not sufficient for achieving the overarching goal of monitoring
Perhaps the fastest-growing category of monitoring “imposters” is that of the troubleshooting tool. They are also perhaps the most illusory, often providing the specious impression that a system is being monitored when, in fact, it isn’t. The fact is that troubleshooting tools don’t identify potential problems before they manifest as actual issues. Instead, they are designed as “response” tools, allowing users to gather a clearer picture of what is happening within a system after it functionally breaks and generates user complaints. Obviously, looking to fix a system only after KPIs have been negatively impacted is not ideal, and this is precisely the function that troubleshooting tools are designed to serve. A true monitoring solution allows you to identify these issues before they propagate.

Finding a true machine learning monitoring solution
With so much noise and confusion surrounding the concept of ML monitoring, it’s no wonder that business leaders and even technical personnel are mystified when it comes to choosing the correct tool for their use case. We hope that this article has helped to delineate what a true monitoring solution provides. Namely, when evaluating and testing products, you’ll want to ensure that they aren’t
- conflating devops-oriented monitoring (APM, cloud infra) with algorithmic and data monitoring.
- conflating monitoring with other fancy-sounding capabilities such as explainability and fairness
- conflating a full-scale solution with a specific layer of it; for example, anomaly detection or troubleshooting
Most importantly, you’ll want to verify that the solution you’re considering has the ability to detect and provide information about nascent issues before they bubble into something much more complex, difficult to disentangle, and deleterious to downstream business KPIs. If you would like to learn more about what ML monitoring solution is right for you, contact us to discuss your monitoring needs.